Skip to content






Solar Farm Infrastructure Explained: Key Components and Community Role
Site Selection and Feasibility for Large-Scale Solar Farms
Developing a 10 MW large-scale solar farm begins with a comprehensive site selection and feasibility study addressing technical, economic, and regulatory criteria. Solar irradiance is measured using meteorological data or satellite analytics, with viable sites typically exhibiting an average annual horizontal global irradiance exceeding 1500 kWh/m2/year to ensure adequate energy production and financial sustainability.
Proximity to grid infrastructure requires locating the site within approximately 2-5 kilometers of substations rated for at least 10 MW capacity to reduce the costs of power evacuation and avoid extensive grid reinforcements. This also lowers transmission losses, generally around 2-3% for distances under 5 km at medium voltage (10-33 kV).
Legal feasibility involves checking land zoning, use restrictions, and environmental regulations including assessments for biodiversity, water runoff, and soil protection, in compliance with European Union directives and local legislation. These inputs constrain site design, particularly regarding panel layout and infrastructure footprint.
This assessment phase generally extends over 6 to 12 months and incorporates topographic surveys, environmental impact studies, stakeholder consultations (including local communities and grid operators), and preliminary system design to support permit applications and financial underwriting.
- Solar irradiance threshold: >1500 kWh/m2/year.
- Grid proximity: Substations rated ≥10 MW within 2-5 km.
- Regulatory compliance: Land use, environmental impact per EU directives and local law.
- Feasibility duration: 6–12 months including surveys and consultations.
Core Infrastructure: Solar Panels, Mounting Systems, and Electrical Components
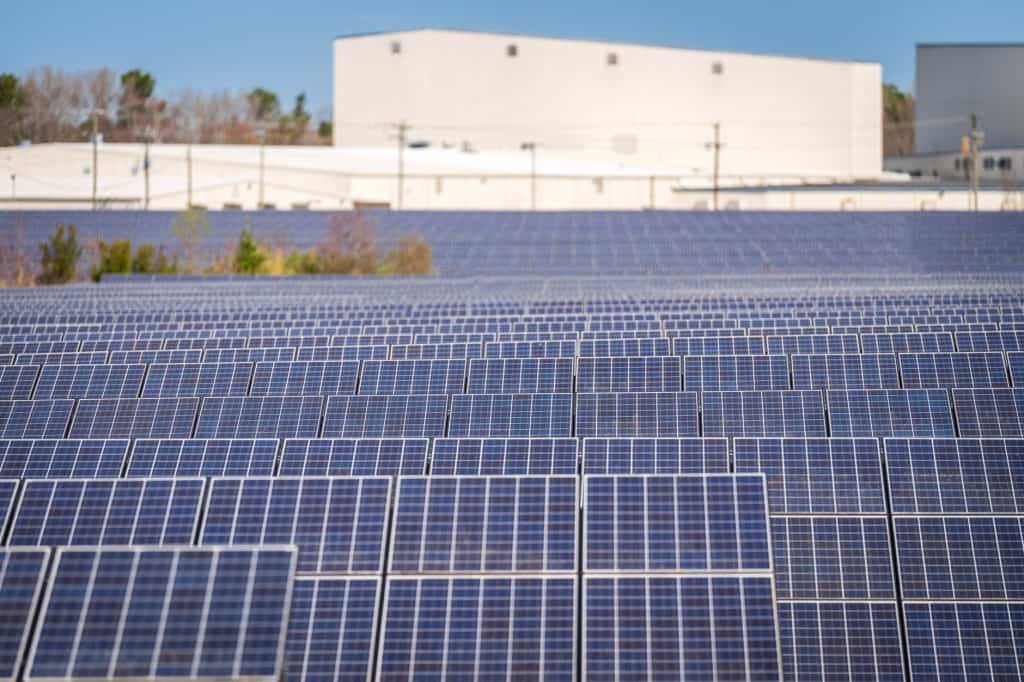
At the core of solar farm infrastructure are crystalline silicon solar panels, primarily monocrystalline or polycrystalline, with module efficiencies between 18% and 22%. Efficiency impacts the required land area, typically between 4,000 and 5,000 m² per MW installed capacity at 20% efficiency.
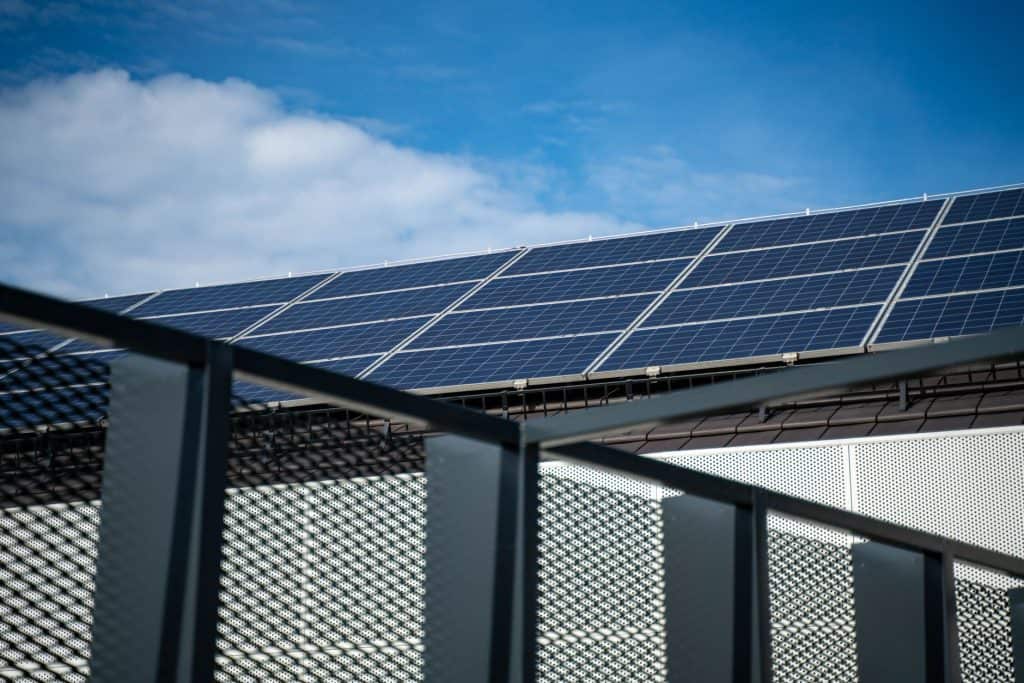
Mounting systems include fixed-tilt mounts optimized to the local latitude (usually 25°-35° tilt) and single-axis trackers which rotate panels east to west to better align with the sun trajectory. Single-axis tracking can boost annual energy yield by 10-25%, raising expected full load hours from approximately 1,200-1,300 to 1,350-1,500 hours per year, albeit requiring 15-30% more site area and 15-25% higher CAPEX.
Key electrical components are DC combiner boxes aggregating currents from series-connected module strings, inverters converting DC to 50/60 Hz AC with typical efficiencies around 98% using technologies such as IGBT-based string or central inverters, and medium-voltage transformers that step up voltage to 10-33 kV for grid compatibility. The choice of transformer voltage depends on grid connection requirements and grid operator standards.
Panels conform to IEC 61215 and IEC 61730 standards, certifying performance under damp heat, thermal cycling, and electrical safety. Inverters typically comply with IEC 62109-1 and IEC 62109-2 safety and electromagnetic compatibility standards.
- Solar panels: crystalline silicon modules, 18–22% efficiency, 4,000–5,000 m² per MW.
- Mounting: fixed-tilt (25°-35°) vs. single-axis tracking; energy gain 10-25%, higher land and CAPEX.
- Inverters: IGBT string or central, ~98% efficiency, IEC 62109 compliance.
- Transformers step up to 10–33 kV medium voltage for grid connection.
- Certifications: IEC 61215 (performance), IEC 61730 (safety) for panels.
Grid Connection and Power Evacuation Standards
Connecting a 10 MW solar farm to the utility grid requires compliance with local grid codes and regional regulations such as those from ENTSO-E. Requirements include fault ride-through capability, enabling the solar farm to sustain voltage dips of 0.2-0.9 per unit for durations up to several seconds without disconnecting, and anti-islanding protection to isolate the site during grid outages to prevent backfeeding.
The connection agreement formalizes maximum capacity export limits per project phase, protection settings, reactive power management, and power factor constraints, typically within ±0.95 range. Installation of protection relays coordinated with the distribution network operator is mandatory for safety.
SCADA systems are integral, enabling real-time monitoring, remote control, and data logging to track plant health and output. These systems use protocols like IEC 61850 for interoperability and cybersecurity standards to protect control infrastructure.
Grid approval procedures encompass preliminary technical studies, impact analyses on voltage and frequency stability, and commissioning tests, with overall timelines spanning 6 to 9 months post-application, contingent on early developer-grid operator cooperation.
- Connection capacity: up to 10 MW export per phase with contractual agreement.
- Grid code compliance includes fault ride-through (0.2–0.9 pu voltage dips) and anti-islanding.
- SCADA systems employing IEC 61850 protocols for remote operation.
- Grid approval timeline: 6–9 months involving technical assessment and commissioning.
Operational Maintenance and Performance Monitoring
Maintaining the solar farm’s operational efficiency demands systematic maintenance programs. Modules are cleaned every 2 to 3 months using automated or manual methods, optimizing the trade-off between water consumption and energy yield impact, which can reach 5-10% in dusty conditions.
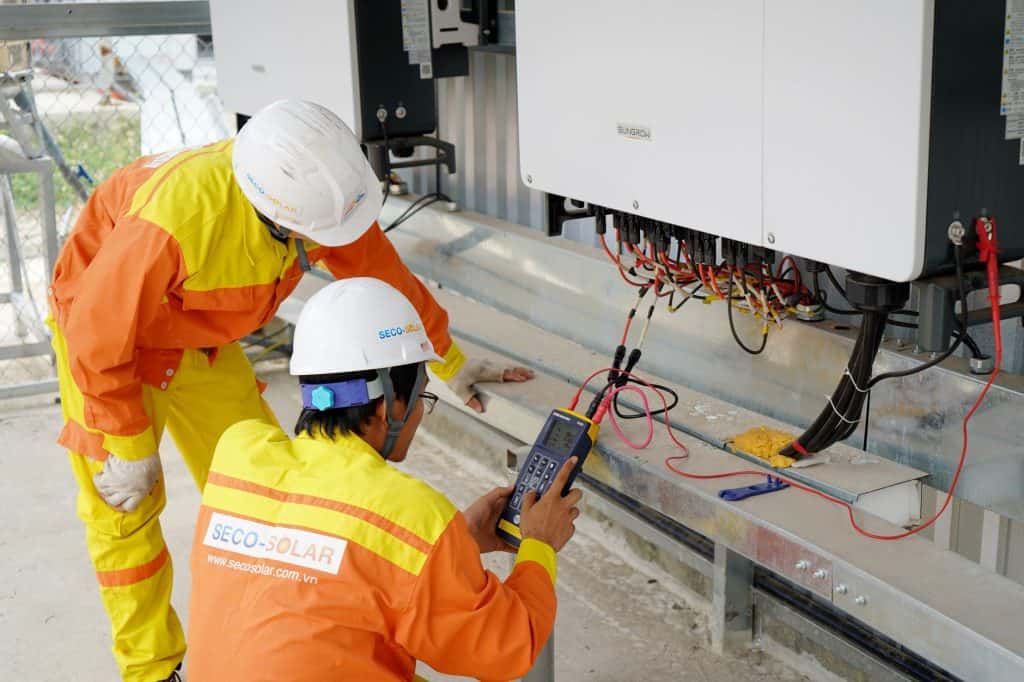
Key electrical components, including inverters and transformers, undergo scheduled inspections and preventive maintenance annually or as recommended by manufacturers to ensure optimal performance and extend lifespan.
Performance is tracked through SCADA platforms collecting performance ratios, string-level production data, and environmental metrics such as irradiance and temperature to detect anomalies promptly. Operations teams respond to alerts to maintain operational availability above 98% annually, minimizing downtime.
Operating and maintenance (O&M) expenses commonly range from 1% to 2% of the original CAPEX per annum in temperate climates, covering labor, replacement parts, insurance, and remote monitoring services.
- Panel cleaning: every 2–3 months; yield recovery 5-10% depending on dust.
- Electrical inspections: inverter and transformer annual preventive maintenance.
- Operational availability target: >98% uptime via SCADA monitoring.
- Annual O&M budget: 1–2% of CAPEX, including labor and monitoring.
Community Solar Integration and Garden Membership Model
Solar Plus Garden illustrates an innovative community solar approach combining large-scale solar farm operation with regenerative agriculture and community participation. The solar asset is held by an Estonian OÜ legal entity, while the related Garden community operates through a separate Serbian DOO, legally isolating investment and community engagement.
The Garden membership model grants access through a one-time €200 membership fee plus an optional €20 monthly Garden Box subscription delivering fresh, locally grown vegetables. Membership fees aggregate into a fund invested in solar infrastructure, generating returns to finance community programming and operational costs.
The Garden community structure supports up to 3,000 parcels (garden boxes), expanding inclusivity by allowing non-investors into the community without requiring direct solar asset ownership. This separation pragmatically addresses barriers for small and medium investors, fostering broad participation.
Legal and financial frameworks incorporate transparent payment handling, escrow arrangements, and accounting practices that restrict fund disbursement without multi-party oversight, assuring compliance and sustaining investor confidence.
- Ownership: Estonian OÜ (solar assets) and Serbian DOO (Garden community).
- Membership fees: €200 one-time + optional €20/month Garden Box.
- Capacity: up to 3,000 Garden parcels accessible without solar investment.
- Transparent and regulated fund management via escrow mechanisms.
Types of Solar Farms and Technology Choices for 10 MW Scale
Large-scale solar farm technology choices affect yield, capital cost, site use, and social impact. Fixed-tilt installations are simpler and less costly to build and maintain, favored where land is limited or capital constrained. Typical tilt angles range from 25° to 35° matched to location latitude for optimal yearly irradiation.
Single-axis tracking systems add mechanical complexity and costs—approximately 15-25% more CAPEX—but can increase annual full load hours by 10-25%, with typical yields rising from around 1,200-1,300 hours to up to 1,500 hours. Dual-axis tracking, while offering further gains, is typically cost-prohibitive at 10 MW scale due to complexity and maintenance.
Panel technology options include monocrystalline modules, which offer higher efficiencies (up to 22%) and smaller space requirements, and polycrystalline panels, which trade slightly lower efficiency (18-20%) for reduced module costs. The choice impacts land footprint and overall project economics.
A growing trend is agrivoltaics, integrating solar infrastructure with agricultural production beneath or adjacent to solar arrays. This dual-use approach improves land use efficiency by combining energy and food production and enhances community acceptance through tangible local benefits, aligning with sustainable future goals.
- Mounting systems: fixed-tilt (baseline), single-axis (10-25% yield gain), rare dual-axis.
- Solar panel types: monocrystalline (higher efficiency) vs. polycrystalline (cost-effective).
- Agrivoltaics enabling combined crop and solar energy production.
- Expected energy yield: 1100–1500 full load hours per year, dependent on tech and location.
- Technology choice impacts land use, CAPEX, and community acceptance.
Investment and Regulatory Framework Impacting Solar Farm Development
Investment decisions for a 10 MW solar farm depend on securing environmental impact assessments, construction permits, and grid connection approvals as mandated by local and EU regulations. These processes ensure environmental protection, safety, and integration feasibility.
Government support programs, such as feed-in tariffs or auction schemes, influence financial returns but vary by jurisdiction and are subject to change in 2026-2027, necessitating current regulatory review for each project.
Capital expenditures typically range from €700,000 to €1,000,000 per MW installed, reflecting variances in technology selection, land conditions, labor, and grid interconnection complexity.
Solar Plus Garden maintains transparent project reporting consistent with Estonian OÜ and Serbian DOO regulatory frameworks, supporting investor confidence through clear financial disclosures and governance.
The overall development timeline generally spans 1.5 to 2 years, including 6-12 months for feasibility and permitting, 6-9 months for grid approval, and 6-12 months for construction, subject to local conditions.
- Permits: Environmental impact and construction permits required.
- Capital expenditure range: €700,000–€1,000,000 per MW installed.
- Policy and tariffs subject to 2026-2027 regulatory changes.
- Regulatory transparency under Estonian and Serbian law supports investment.
- Typical project duration: 18–24 months from feasibility to commissioning.
Illustration: Typical Cost Breakdown for a 10 MW Solar Farm Infrastructure
The table below illustrates an assumed capital expenditure allocation for a 10 MW solar farm with a €800,000 per MW total cost baseline, reflecting typical large-scale solar technology choices.
| Cost Component | Percentage of CAPEX | Cost per MW (€) | Description |
|---|---|---|---|
| Solar panels | 40% | 320,000 | 18–22% efficiency crystalline silicon modules, largest cost portion. |
| Inverters & Electrical | 25% | 200,000 | Includes DC combiner boxes, wiring, and 98%-efficient inverters. |
| Mounting & Civil Works | 20% | 160,000 | Fixed or tracking mounting structures, foundations, site preparation. |
| Grid Connection | 10% | 80,000 | Transformers, protection relays, interconnection equipment. |
| Balance & Miscellaneous | 5% | 40,000 | Permitting, engineering, design, and management overhead. |
Operational costs typically add 1-2% of CAPEX annually over the lifecycle, covering maintenance, insurance, and monitoring. The Solar Plus Garden’s community solar model generates additional funds through Garden membership fees, supporting local projects and reinforcing the positive impact of the solar investment beyond pure energy production.
Choosing between fixed-tilt and tracking systems involves balancing initial CAPEX against increased energy output and land use impacts, directly influencing project payback periods and sustainable future planning.
Frequently Asked Questions
What components make up the infrastructure of a 10 MW solar farm?
Core components include crystalline silicon solar panels (18-22% efficiency), fixed-tilt or tracking mounting systems, inverters converting DC to grid-compliant AC at approximately 98% efficiency, electrical wiring with DC combiner boxes, medium-voltage transformers stepping voltage to 10-33 kV, and grid interconnection equipment adhering to ENTSO-E and local grid codes.
How does the Garden membership model relate to solar farm investments?
The Garden membership model separates community solar access from direct ownership of physical solar assets. Members pay a membership fee plus optional monthly contributions, which are pooled into solar investments. Revenues from these investments fund community programming, enabling non-investors to enjoy benefits such as fresh produce through regenerative agriculture alongside solar energy support.
What is the typical timeline for developing a solar farm from site selection to connection?
The process typically begins with a 6-12 month feasibility and permitting phase, followed by 6-9 months for grid connection approval, and a 6-12 month construction period, totaling approximately 18 to 24 months from inception to commissioning.
What ongoing maintenance activities are essential to keep the solar farm efficient?
Essential maintenance includes panel cleaning every 2 to 3 months to mitigate output loss due to soiling, annual inspections and servicing of inverters and transformers, continuous performance monitoring via SCADA systems, and prompt corrective maintenance to sustain operational availability above 98%.
Investors, developers, and property owners evaluating large-scale solar projects should begin with rigorous site feasibility analyses and regulatory research. Understanding core solar farm infrastructure and detailed cost breakdowns optimizes financial and technical design decisions. Community solar models like Solar Plus Garden offer a complementary path, combining solar technology deployment with local social value, enhancing the positive impact and supporting a sustainable future. Adapting to evolving grid regulations, technology standards, and market conditions remains essential throughout project lifecycles.