Vai al contenuto





Solar Energy Production Forecasting: Key Methods and Applications for 2026
Factors Affecting Solar Energy Production Forecasts
Solar energy production forecasting relies primarily on solar irradiance, measured in watts per square meter (W/m²). Under clear skies at sea level, solar irradiance reaches up to approximately 1000 W/m² at peak solar noon. Hourly fluctuations in irradiance driven by atmospheric conditions such as cloud cover, aerosols, and humidity directly affect fotovoltaico (PV) output. For example, cloud transients can cause irradiance reductions of 50-70% within minutes, creating challenges for intraday solar power forecasts.
Ambient temperature influences solar module efficiency; PV panel output typically decreases by 0.3% to 0.5% per degree Celsius rise above the standard testing condition of 25°C, due to increased semiconductor junction temperature. Seasonal and diurnal cycles establish predictable variation patterns, with summer months providing up to 30-40% more irradiance and longer daylight hours than in winter at mid-latitudes. This seasonality is accounted for in all operational prediction models.
Physical characteristics including module tilt angle, azimuth orientation, and shading factors affect site-specific solar energy production. Optimal tilt angles usually match site latitude within ±10°, maximizing annual energy yield. Shading from nearby vegetation or structures can reduce output by 5-20%, depending on shading extent and duration. Altitude further modulates irradiance; sites 1000 meters above sea level receive approximately 10-15% more irradiance compared to sea level due to thinner atmosphere and reduced scattering.
Microclimate effects in urban environments may cause localized irradiance variability. These localized factors require high-resolution meteorological data and precise site modeling to improve forecast reliability.
Prediction Models Used in Solar Power Forecasting
Solar power forecast models span statistical, physical, and hybrid approaches, each suited to different forecast horizons and conditions. Statistical models apply time-series analysis, such as autoregressive integrated moving average (ARIMA) and regression techniques, using historical production and weather data to extrapolate short-term trends. These models are computationally efficient but often limited by their inability to capture sudden weather shifts.
Physical models incorporate Numerical Weather Prediction (NWP) outputs, which use atmospheric simulation data from sources like the European Centre for Medium-Range Weather Forecasts (ECMWF) or the Global Forecast System (GFS). These models calculate solar irradiance on tilted planes by applying radiative transfer equations adjusted for aerosol optical depth, cloud cover, and water vapor. Physically based models better suit day-ahead forecasts with horizons of 24 to 72 hours, trading computation time for higher accuracy in variable weather conditions.
Hybrid models integrate statistical and physical data. For example, NWP forecasts provide baseline irradiance estimates fed into machine learning algorithms such as gradient boosting machines or convolutional neural networks to capture non-linear dependencies and correct model biases. This approach can reduce root mean square error (RMSE) in short-term forecasts by 15-25% compared to standalone statistical or physical models.
Artificial intelligence (AI) techniques, including deep learning with long short-term memory (LSTM) networks, leverage streaming sensor and weather data to further decrease forecast error margins. These AI models are particularly effective for horizons under 6 hours, allowing intraday solar power forecast improvements critical for grid balancing and energy markets.
Operationally, day-ahead solar power forecasts prioritize physical and hybrid models due to reliance on NWP data, while intraday forecasting utilizes AI-driven methods leveraging pyranometer, satellite, and automated weather station data updated at 1-5 minute intervals.
Data Inputs and Sensors for Enhancing Forecast Accuracy
Accurate solar power forecast models depend on diverse data inputs. Pyranometers provide direct normal irradiance (DNI) and global horizontal irradiance (GHI) measures with sampling frequencies typically ranging from 1 to 15 minutes, providing real-time irradiance data critical for model calibration.
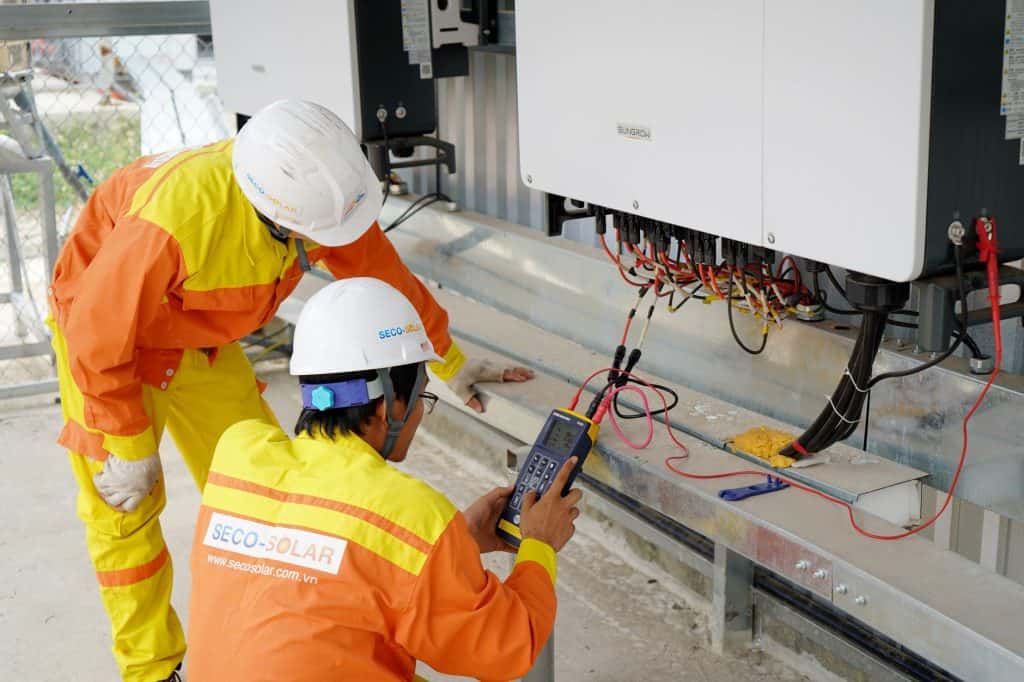
Temperature sensors installed near PV arrays monitor ambient and module surface temperature, enabling dynamic adjustment of forecasted panel efficiency. Reference cells with temperature correction are also used to gauge array performance for model validation.
Satellite platforms such as the Himawari-8 and GOES series provide cloud cover imaging at resolutions between 0.5 and 2 km every 5 to 15 minutes. This data supplements ground measurements by mapping cloud evolution over larger geographic areas, improving cloud-advection-based intraday forecasts.
Automated weather stations (AWS) deployed across sites measure meteorological variables such as wind speed, relative humidity, and barometric pressure, which influence irradiation and module temperature profiles. Integration of real-time AWS data with PV asset monitoring systems facilitates operational forecasting updates and performance tracking.
Energy operators use Application Programming Interfaces (APIs) to access these diverse data sources systematically. APIs deliver structured data via RESTful services in JSON or XML formats, enabling integration with energy management systems, grid operation platforms, and investor dashboards. This integration allows updating forecasts at frequencies as high as every 5 minutes, vital for grid-responsive resource dispatch and community energy planning.
Grid Integration and the Impact of Solar Forecasting on Electricity Markets
Accurate solar power forecasts directly impact grid reliability and market operations. Grid operators rely on day-ahead forecasts to determine reserve scheduling; forecast errors translate to additional balancing costs, which can increase operational expenditures by 5-10% for solar shares exceeding 10% of total grid capacity.
Forecasts guide dispatch of energy storage systems by predicting generation windows and variability, optimizing battery charge/discharge cycles within operational state-of-charge limits. This approach reduces curtailment and improves local voltage regulation.
European transmission system operators (TSOs), including ENTSO-E members, generally mandate solar generators submit day-ahead forecasts with mean absolute error (MAE) under 10% of installed capacity, aligning with ENTSO-E’s forecast performance recommendations. Non-compliance can lead to financial penalties or grid access restrictions.
In wholesale electricity markets, solar producers align bidding strategies with forecast power output to minimize imbalance penalties. Accurate forecasts improve forecast solar submission credibility, reducing uplift charges and allowing better price signals. Electricity market software integrates forecast data to optimize dispatch schedules and bidding windows.
Ancillary services such as frequency regulation and voltage support require transparent, timely forecasting to anticipate rapid output changes. This allows system operators to deploy fast-ramping reserves and reactive power support effectively.
Solar Energy Production Forecasting for Agrivoltaic and Community Projects
Agrivoltaic systems combine photovoltaic arrays with agricultural land use, presenting distinct challenges for solar power forecasts. The crop canopy creates variable shading patterns, fluctuating hourly and seasonally, altering irradiance distribution across PV modules. These effects cause forecast degradation by approximately 5-15%, depending on crop type, density, and growth stage.
Forecast models for agrivoltaic setups incorporate light distribution simulation and temperature microclimate measurements. Adjusting physical model inputs for shading coefficients and dynamic albedo effects improves prediction accuracy and supports precise energy yield estimates.
Community energy platforms such as Solar Plus Garden utilize solar power forecasts for operational planning beyond electricity generation. Forecast data inform garden activity scheduling, including irrigation, planting, and harvesting coordination, funded through solar revenue streams. The transparency of forecast solar data supports community trust and financial planning.
Such coupling of solar energy production forecasting with community engagement enables long-term monitoring of both energy and agricultural outputs, aligning financial sustainability with social benefits. This integrated approach strengthens regulatory compliance and investment attractiveness.
Available Solar Power Forecasting APIs and Software Solutions in 2026
As of 2026, multiple commercial solar power forecasting APIs cater to diverse user needs. Providers such as Solcast, Tomorrow.io, and Meteomatics offer RESTful interfaces delivering real-time, intraday, and day-ahead solar power forecast data with typical RMSE levels below 12%, contingent on site data density and model sophistication.
Forecast horizons span from 15-minute intervals up to 7 days ahead, supporting operational decisions from grid balancing to long-term asset management. APIs commonly include bundled datasets—NWP outputs, ground sensor feeds, and satellite-derived cloud cover—enhancing forecast robustness.
Integration features often cover automated data sampling, alert triggers for forecast anomalies, and site-specific customization parameters to adjust for local shading, tilt, and module specifications. Compatibility with SCADA and energy management systems (EMS) is standard, enabling seamless use in large-scale solar projects and community energy platforms like Solar Plus Garden.
Scalability considerations involve data latency (typically under 5 minutes), throughput, and concurrent request limits, critical for real-time operational environments. Vendors provide detailed Service Level Agreements (SLAs) and compliance certifications aligned with data security and privacy regulations.
Verification Metrics and Reporting Standards for Solar Forecasts
Verification of forecast solar performance involves several quantitative metrics. Root mean square error (RMSE) expresses the standard deviation of forecast residuals, typically reported as a percentage of installed capacity or peak power. Mean absolute error (MAE) quantifies average unsigned forecast deviations, while forecast bias measures systematic over- or under-prediction tendencies.
Forecast verification intervals range from 15 minutes to daily aggregates, aligned with operational needs. The IEC 61724-1 standard defines performance monitoring procedures for photovoltaic systems and includes guidance on forecast verification methodologies, ensuring consistent reporting across projects.
Benchmarking forecast outputs against actual measured energy yields requires synchronized time-series data with sensor-based operational records to isolate model errors from hardware or communication faults. Detailed verification reports enhance investor confidence, support regulatory compliance, and guide iterative improvements in prediction models.
Continuous recalibration cycles use verification outcomes to update model parameters seasonally or after significant weather pattern shifts, maintaining forecast accuracy within contractual thresholds and grid operator requirements.
Illustration: Year-by-Year Accuracy Improvement in a 10 MW Solar Plant Forecast
Consider a 10 MW photovoltaic solar plant where forecast accuracy improves through staged investments in measurement infrastructure and model refinement over three years. The following table illustrates hypothetical RMSE and MAE improvements and associated operational impacts:
| Year | RMSE (% of capacity) | MAE (% of capacity) | Impact on Operational Costs | Community Funding Benefit |
|---|---|---|---|---|
| 1 | 15 | 12 | Higher reserve scheduling costs (~8% increase) | Limited contingency funds for maintenance and garden activities |
| 2 | 11 | 9 | Moderate cost reduction in balancing and reserve dispatch (approx. 4%) | Improved reliability in revenue streams supporting community engagement |
| 3 | 8 | 6 | Notable operational savings enabling optimized grid and market participation | Supports expansion of garden membership activities and infrastructure |
These progressive accuracy enhancements reduce imbalance penalties, optimize battery utilization, and increase solar revenue reliability. For community projects like Solar Plus Garden, such improvements underpin scalable and transparent management of solar energy assets and associated social benefits.
Domande frequenti
What factors cause variability in solar energy production forecasts?
Variability is primarily driven by fluctuations in solar irradiance due to cloud movement, atmospheric aerosols, humidity, temperature effects on PV efficiency, shading patterns, and seasonal daylight variation. Detailed local weather monitoring, high-resolution irradiance sensors, and site-specific parameters help reduce forecast uncertainty.
How do forecasting models differ for short-term versus long-term solar power predictions?
Short-term forecasts (up to 6 hours ahead) rely on real-time sensor data and AI techniques such as machine learning models fed by high-frequency weather updates to capture rapid interruptions. Long-term forecasts (day-ahead to multi-day) depend more on physical models incorporating Numerical Weather Prediction (NWP) data and historical production statistics to generate stable outlooks.
How can solar production forecasts improve grid stability and investment outcomes?
Accurate solar power forecasts enable grid operators to anticipate supply variability, reducing the need for costly reserve power and enhancing frequency control. Investors gain from reduced operational risk, improved predictability for maintenance scheduling, and transparent allocation of revenues supporting community initiatives like Solar Plus Garden.
What are the benefits of using an API for solar energy production forecasting?
APIs provide streamlined, real-time access to forecast solar data in standardized formats. This facilitates integration into energy management and grid operation systems, enabling automated operational responses, optimized bidding strategies, and transparent reporting essential for investor relations and community project governance.
Careful understanding of the interplay among forecast drivers, prediction models, data inputs, and grid regulations equips property owners, project developers, contractors, and investors to make informed decisions. In 2026 and beyond, advanced solar energy production forecasting tools will be central to optimizing large-scale photovoltaic plants and initiatives combining solar with community benefits, such as Solar Plus Garden. These tools require continual adaptation as technology evolves and market conditions change.
Letture correlate
- Metodi efficaci di controllo biologico dei parassiti per una gestione sostenibile del giardino.
- Comprendere l'energia solare a concentrazione: tecnologia, applicazioni e considerazioni sugli investimenti
- In che modo il credito d'imposta per la produzione di energia solare influenza le decisioni di investimento nei progetti di energia pulita?