Vai al contenuto





Impact Investing Solar Energy: Read the Capital Stack
Impact investing solar energy means allocating capital to a solar asset with a stated, measurable social or environmental objective alongside a financial return. The word that does the work is measurable. An objective you cannot verify with a metric, a baseline and a reporting cadence is marketing copy, not an investment criterion. The second thing that determines your outcome is less discussed: where your money sits in the capital stack. Two investors can fund the same 10 MW plant and hold completely different risk, different return and different control. This article reads that structure from the bottom up, so you can size a position on evidence rather than narrative.
Why Impact Investing Solar Energy Depends on Where Your Money Sits
A 10 MW-class plant is not funded by one cheque. It is funded by a stack of claims, each with a different priority over the project’s cash flow. A retail or SME investor can occupy four positions in that stack, and the position — not the project — sets most of your risk.
- Senior debt. First claim on project cash flow, fixed coupon, covenant-protected. Targets capital preservation. In a project finance structure it typically carries the lowest return and the earliest certainty. Lenders usually size it against a debt service coverage ratio (DSCR) of roughly 1.10–1.30x, tested in the base case and again under stress.
- Subordinated or mezzanine loan. Sits behind senior debt, so it is paid only after senior service is met. Higher coupon, more exposure to construction and offtake risk.
- Equity share. Residual claim: paid last, absorbs construction delay, curtailment and tariff downside, keeps the upside. Highest variance.
- Pooled community membership. A membership fee aggregated with other members and invested in solar, with community activities funded from solar revenue. Ticket size is small; control is collective; liquidity is defined by the scheme’s rules, not by a market.
The table below is the mental model to hold for the rest of this article. It is an illustration of claim priority, not a term sheet.
| Layer | Claim priority | Main risk exposure | Return character |
|---|---|---|---|
| Senior debt | First | Counterparty and operating underperformance | Fixed coupon, lower |
| Mezzanine | Second | Construction delay, offtake, curtailment | Fixed or fixed-plus, higher |
| Equity | Residual | All of the above plus tariff and residual value | Variable, wider range |
| Pooled membership | Per scheme rules | Whatever the pooled vehicle holds | Depends entirely on the vehicle |
A appartenenza alla comunità position is not a fourth asset class; it is a wrapper around whichever of the three layers the scheme actually buys. Your first diligence question is therefore not “what return?” but “what does the vehicle hold, and where does it sit?” Portfolio construction follows the same logic: a portfolio of solar positions concentrated in one layer, one jurisdiction and one offtaker is not diversified, however many projects it names. Diversify across offtakers and jurisdictions before adding projects in the same market.
The 2026–2027 caveat. Support schemes, feed-in tariffs, contract-for-difference terms and tax treatment differ by jurisdiction and are subject to change. Nothing in this article sizes a position for you. Verify the local rules — and the date they were last confirmed — before committing capital.
How a Solar Asset Turns Sunlight Into a Payable Cash Flow
The chain from irradiance to invoice has five links: module DC capacity, inverter AC capacity, performance ratio, degradation, and the offtake contract that converts kilowatt-hours into revenue. Each link is a place where the modelled number can slip. The DC-to-AC ratio (often 1.10–1.30) caps how much generation an inverter can turn into AC output; a high ratio raises yield per inverter euro but clips peak output on the brightest days.
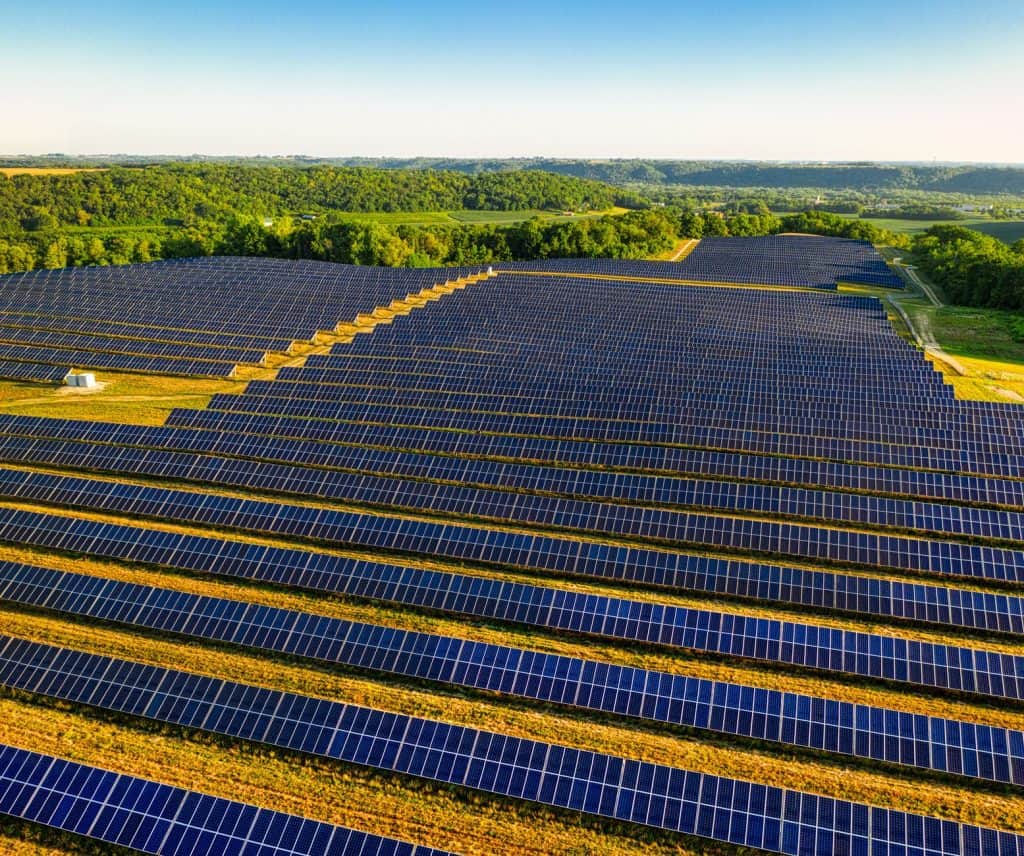
Take a 10 MWp plant in southern or central Europe, where specific yield commonly falls in the range of roughly 1,100–1,400 kWh per kWp per year depending on location, mounting and layout. At 1,250 kWh/kWp/yr, annual generation lands near 12.5 GWh. That is an illustration with stated assumptions, not a forecast for any specific site.
Now apply degradation. At an illustrative 0.5% per year, the revenue line declines every year of a 25-year horizon:
| Year | Generation (GWh, illustrative) | Note |
|---|---|---|
| 1 | 12.50 | Baseline at 1,250 kWh/kWp/yr |
| 5 | 12.25 | Cumulative degradation applied |
| 10 | 11.94 | O&M cost per kWp typically unchanged |
| 20 | 11.35 | Inverter replacement may fall in this window |
| 25 | 11.03 | End of typical modelled horizon |
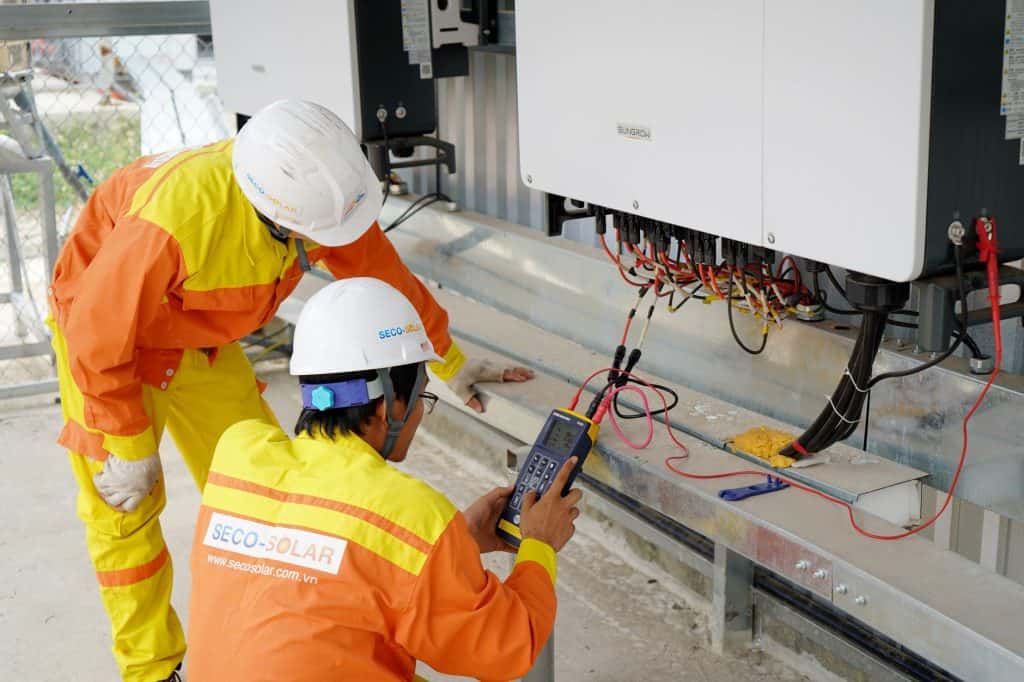
Two operating facts drive whether actual output matches this sketch. First, the inverter architecture: string inverters lose less output when one unit fails and are cheaper to replace unit by unit; central inverters concentrate efficiency but concentrate downtime. Second, mounting: trackers raise yield per kWp but add moving parts and maintenance, while fixed-tilt is simpler and cheaper to insure. Over both sits the SCADA monitoring layer, which flags underperformance against the modelled performance ratio. If an investor report cannot show you performance ratio against a model, it cannot show you whether the asset is working.
Agrivoltaico modifies both revenue and risk. Elevated mounting allows crop production beneath or between rows and can preserve farm income, but it raises capital cost per kWp and changes O&M access — mowers, module cleaning and cable routes all get harder. Treat co-location as a separate business case with its own costs and its own contract, not as free upside attached to the solar case. That discipline is what separates sustainable solutions from sustainability claims.
Where Impact Investing Solar Energy Sits Among Green Bonds and Venture Capital
Solar capital reaches investors through several very different channels. Comparing them on return alone misses the point; risk, liquidity, control and reporting format differ more than yield does.
- Green bond. A debt instrument issued by an entity, with proceeds allocated to eligible projects and reported against a framework. Where the issuer follows the ICMA Green Bond Principles — or the EU Green Bond Standard, which is being phased in — you get allocation and impact reporting at the issuer level. You do not own the plant; you hold the issuer’s credit risk.
- Venture capital. Equity into solar developers, manufacturers or software. Illiquid, high variance, and exposed to technology and execution bets rather than to the output of a generating asset. Venture capital and owning a plant are not substitutes in a portfolio.
- Direct project equity. A claim on a specific asset’s cash flow. Asset-backed, illiquid, governed by covenants and shareholder agreements. Diligence burden sits on you.
- Pooled community membership. Small ticket, collective governance, entry through a defined process. Liquidity usually limited to a stated exit or secondary mechanism.
| Channel | Typical ticket | Liquidity | Control | Reporting format |
|---|---|---|---|---|
| Green bond | Bond lot size, exchange-dependent | Tradable if listed | None over projects | Allocation and impact report per framework |
| Venture capital | Fund minimum, often high | None until exit | Indirect, via fund | Fund letters, portfolio company updates |
| Direct project equity | High, driven by per-investor legal cost | None without a buyer | diritti degli azionisti | Project production and financial reports |
| Pooled community membership | Low, set by scheme | Per scheme rules | Collective | Scheme-level reports |
Label that table an illustration: ticket sizes are set by issuers, funds and schemes, not by the technology. The reporting contrast is the practical one. A green bond investor reads an issuer’s framework report; a private project investor reads meter data, availability figures and a cash waterfall. If you are evaluating an impact investing position, ask which of those two you will actually receive, and how often.
What Energy Justice Looks Like When You Underwrite a Solar Project
Energy justice becomes an underwriting test when you convert it into three questions: who bears the siting burden, who receives the electricity or its value, and whether local households or farmers gain a measurable benefit. A project can be clean and still fail all three.
A diligence file should answer five questions before capital moves:
- Land tenure. What are the lease terms and duration, who holds the rights, and are water rights addressed if crops are involved?
- Consultation evidence. Is there a record of community consultation — dates, attendees, objections raised and responses — rather than a claim that consultation happened?
- Benefit-sharing mechanism. Does value flow to the host community through a named mechanism such as community energy participation, a local revenue share or direct payments, and is that mechanism contractual?
- Local hiring commitment. What employment is committed during construction and operation, and is it a contract term or an aspiration?
- Reporting cadence. What metric, measured how, reported to whom, and how often?
Co-location with agriculture changes the justice equation in both directions. It preserves land use and farm income where a project would otherwise remove farmland from production, but only if lease and water rights are clear and the crop plan is contractually supported. An agrivoltaic layout without a farming counterparty is a solar plant with higher steel and a story attached.
Positive impact claims without a baseline and a measurement method are not investment criteria. Ask for the metric and the reporting frequency in writing. If the answer is a narrative, note it as marketing and price the position without it.
The Risks That Turn a Positive Impact Story Into a Loss
Impact does not reduce financial risk; it sits alongside it. The risks below are the ones that most often convert a good story into a loss, and each has a contractual instrument that should appear in the term sheet.
| Risk | Mitigating instrument | Where to find it |
|---|---|---|
| Construction delay and cost overrun | Fixed-price EPC contract with liquidated damages | EPC contract, construction schedule |
| Technology underperformance | Module and inverter performance guarantees; O&M availability guarantee | Supply warranties, O&M contract |
| Offtake and counterparty default | PPA with creditworthy offtaker; termination payments | PPA and offtaker credit review |
| Curtailment and grid limits | Grid connection agreement; curtailment compensation terms | Grid connection and PPA terms |
| Tariff or subsidy reduction | Stress test; reserve or guarantee where it exists | Financial model, term sheet |
Regulatory risk deserves a line of its own. Tariff and subsidy regimes in 2026–2027 are subject to change. A position underwritten on a current support level must be stress-tested against a reduction, and the term sheet must state who bears it. If nobody can answer that, the model is not finished.
Structure risk is where small investors are most often hurt. Two patterns recur: unclear legal separation between the asset-owning entity and affiliated businesses, and arrangements described as “escrow-like” that are not a real escrow with a named provider and a signed agreement. A portfolio is only as strong as the boundary between the plant’s cash flow and everything else attached to it.
Reading the Legal Structure Behind the Impact Claim
Cross-border projects commonly use an EU holding entity — an Estonian OÜ, for example — alongside a local operating company that owns the plant. The boundary between the two must be defined in writing. Incorporation date and registered address are verifiable facts; check them in the relevant company register before transferring funds, and confirm which entity actually holds the generating asset.
The community or garden side of a project should sit in a separate legal entity with a defined licence to use the concept. That separation matters in both directions: community obligations should not encumber the generating asset, and the generating asset’s debt should not be able to consume community funds. When a project mixes membership revenue, produce subscriptions and plant cash flow in one entity, the investor cannot tell which money is investment and which is fee.
Five documents answer the structural question:
- Articles of association — how the entity is governed, who can bind it, and what reserved matters need consent.
- Shareholder or membership agreement — your rights, exit terms, and how decisions are made collectively.
- Offtake contract or PPA — how kilowatt-hours become revenue and who carries price risk.
- Land lease — tenure, duration and conditions that could end the project’s right to operate.
- Payment or escrow agreement — who holds funds, on what conditions they are released, and what controls prevent spending without approval.
Social finance structures live or die on this paperwork. If the structure chart does not show which entity owns the plant and which entity holds your money, the impact claim has no foundation to stand on.
A Year-by-Year Payback Sketch for a Pooled Solar Position
Build the model yourself from stated assumptions. The table below is an illustration for a single project position, not a forecast, and the figures are placeholders you should replace with the actual term sheet numbers.
Assumptions, stated openly: capital in at a per-kWp capex you confirm from the EPC contract; specific yield of 1,250 kWh/kWp/yr; 0.5%/yr degradation; a tariff or offtake price you confirm from the PPA; O&M cost per kWp per year; insurance; debt service where the position is levered; and a stated distribution policy.
| Year | Gross generation | Revenue | O&M + insurance | Debt service | Net distributable | Cumulative |
|---|---|---|---|---|---|---|
| 1 | Baseline | Generation × tariff | Per kWp | Per schedule | Residual | Year 1 net |
| 3 | −1.0% vs year 1 | Declining | Flat | Per schedule | Residual | Sum of years |
| 5 | −2.5% vs year 1 | Declining | Flat | Per schedule | Residual | Sum of years |
| 10 | −4.9% vs year 1 | Declining | Flat | Final years | Residual | Sum of years |
The entry position changes the curve more than the plant does. Senior debt earns a lower fixed return with earlier certainty. Equity earns later, with wider variance and the residual value at the end. The same plant, the same sun, two different payback profiles.
Then expose the fees as lines in the model: platform or membership fees, arrangement fees and any performance fee. A fee buried in the narrative is a return reduction you cannot see. If the model only works when the fees are absent, it does not work.
How Small Investors Enter Solar Through Community Membership
Entry follows a sequence, and each step has its own clock. Ask for each one rather than assuming it.
- Express interest and join the waiting list. No funds move at this stage.
- Complete KYC or KYB. Identity and, for businesses, entity verification. This step takes as long as the documentation takes; treat a promised 48-hour approval as a service commitment to confirm in writing.
- Review the term sheet and legal documents. Confirm your position in the capital stack, the fee lines, and the exit terms.
- Fund through the defined payment channel. Confirm whether funds go to an escrow provider or directly to the entity, and under what release conditions.
- Receive confirmation and reporting access. Confirm what you will be sent, on what metric, and how often.
- First reporting cycle. Compare actuals against the model you built.
The membership model as it appears in practice separates three kinds of money. A one-time membership fee is invested in solar; community activities are funded from solar revenue; and optional add-ons, such as a monthly produce box subscription, are a service purchase rather than an investment. Published figures exist for some schemes — for example a €200 one-time membership and an optional €20/month vaso da giardino with 18 deliveries a year — and those are current at time of writing, not fixed offers. Check the live term sheet.
Community schemes lower the ticket size because legal and diligence costs are shared across members. That sharing is also the trade-off: governance is collective, liquidity is defined by the scheme, and your influence over decisions is proportional to the rules rather than to your capital. Read the membership agreement for the exit mechanism before you read the return figure.
FAQ
What is the minimum I can invest in solar through an impact investing model?
Minimums are set by the platform or scheme, not by the technology. Community models can publish entry points in the low hundreds of euros, while direct project equity usually starts far higher because legal and diligence costs are borne per investor. Check the current term sheet for the exact figure and what it includes. Do not treat a published minimum as a fixed offer; terms change.
Is a green bond the same as investing directly in a solar plant?
No. A green bond is a debt instrument issued by an entity, with proceeds allocated to eligible projects and reported against a framework such as the ICMA Green Bond Principles. Direct project investment gives you a claim on a specific asset’s cash flow, typically with less liquidity and more project-specific risk. Both can fund solar; they behave differently in a portfolio.
How do I check whether the impact claim is real?
Ask for the baseline, the metric and the reporting frequency before you commit. A verifiable claim names what is measured — generation, avoided emissions, land preserved, community payments — how it is measured, and who reports it. A narrative without a number and a method is marketing, not an investment criterion.
What happens to my money if the solar project is delayed or the tariff changes?
It depends on the contract. Fixed-price EPC contracts with liquidated damages shift construction delay risk to the contractor. Offtake and tariff risk usually sit with the investor unless a PPA fixes the price. In 2026–2027 support schemes are subject to change, so read the term sheet for who bears a tariff reduction and whether any reserve or guarantee covers it.
Before You Commit
Obtain and read five documents: the legal structure chart showing which entity owns the plant, the term sheet stating your position in the capital stack, the offtake or PPA terms, the payment or escrow agreement, and the reporting commitment with its metric and frequency. Build the payback sketch yourself from stated assumptions and check that the fees appear as lines. If the structure is unclear, the impact claim has no measurement method, or an arrangement is described as “escrow-like” without a real escrow agreement, decline and wait.
What would change that answer: a fully documented structure with a named escrow provider, a signed offtake contract, and a stress test showing the position survives a tariff reduction would move the same project from hold to proceed.
Letture correlate
- Orientarsi nel mondo degli investimenti a impatto sociale nel solare: una guida completa per gli investitori strategici.
- Opportunità di investimento in impianti solari nel 2026: una guida completa agli investimenti nell'energia solare
- Come investire nel solare con un capitale limitato: percorsi pratici per investire nell'energia solare