









Understanding Solar Panel Degradation Rates: What Investors and Property Owners Need to Know
How Solar Panels Degrade: Key Mechanisms Affecting Performance
Solar panels degrade immediately after installation due to multiple degradation mechanisms that reduce panel performance over time. The earliest phase, known as year 1, typically sees an initial degradation rate between 1% and 3%. This early loss results mainly from light-induced degradation (LID), intrinsic to crystalline silicon cells, and initial material stabilization within fotovoltaica (PV) modules.
After year 1, the degradation rate usually declines to an average of 0.5% to 0.8% per year for crystalline silicon technology, which dominates the current solar panels market. This rate reflects cumulative physical and chemical stress effects on module materials.
The main degradation mechanisms affecting panel performance and longevity include:
- Thermal cycling: Daily and seasonal temperature fluctuations cause repetitive expansion and contraction in solar cells and solder joints. This leads to microcracks and solder fatigue, disrupting electrical pathways and reducing efficiency over time. Regions with temperature swings above 30°C typically observe faster degradation via this mechanism.
- UV exposure: Ultraviolet radiation progressively degrades the encapsulant material, usually EVA (ethylene-vinyl acetate). This degradation causes yellowing and loss of transparency, decreasing the effective light reaching the cells, directly impacting the efficiency of solar panels.
- Moisture ingress and Potential Induced Degradation (PID): Water vapor can enter through microcracks or imperfect seals, allowing ionic species to migrate inside the module. PID occurs when voltage-induced leakage currents accelerate corrosion within the cells and interconnections, compromising panel output.
- Delamination and glass corrosion: Environmental exposure can cause detachment of the encapsulant layers or corrosion of the front glass surface. These effects reduce module integrity and alter optical characteristics, causing additional power loss.
- Light-induced degradation (LID): Primarily occurs within the first 100-200 operating hours as boron-oxygen complexes form in silicon cells, causing an initial efficiency drop typically incorporated in the year 1 degradation percentage.
Understanding these degradation mechanisms helps anticipate solar panels degrade at different rates, facilitating design choices and maintenance planning to optimize inversión en energía solar outcomes.
Typical Solar Panel Degradation Rates and Their Impact on Energy Yield
El degradation rate is critical in determining the long-term energy output of solar panels. Industry-standard crystalline silicon panels generally degrade at 0.5% to 0.8% per year after the initial year 1 loss, while thin-film technologies (such as CdTe or CIGS) may degrade at rates up to 1% per year or more, depending on the manufacturer and specific environmental conditions.
For a 25-year project lifespan—the typical warranty period—these rates translate into a cumulative degradation ranging between 20% and 25%. For example, a panel with 0.7% annual degradation and a 2% first-year drop will retain approximately 75-80% of its original power rating at year 25. This decline aligns with standard performance warranties, which generally guarantee no more than 20-25% efficiency loss after 25 years.
Cumulative energy yield reduction follows this sequential calculation:
- Assuming a 2% loss in year 1.
- Subsequent annual losses of approximately 0.7% compound annually.
- After 25 years, the remaining output is roughly 75–80% of initial rated capacity.
Financial models for projects like Solar Plus Garden’s 10 MW facility incorporate these degradation percentages to forecast realistic energy generation and revenue. Over- or underestimating degradation can substantially skew expected cash flows, emphasizing the need for precise, evidence-based assumptions.
Environmental and Climatic Factors That Accelerate Solar Panel Degradation
Climate plays a substantial role in accelerating solar panel degradation beyond baseline rates.
Thermal cycling effects intensify with higher diurnal temperature variation. For example, installations in desert climates with daily temperature swings exceeding 30°C can experience increases in degradation rates by approximately 0.1-0.3% annually above the standard rate, due to heightened mechanical stress on PV cells and interconnections.
Other climatic influences include:
- High UV index: In regions near the equator or at high altitudes, UV intensity increases encapsulant aging and yellowing, potentially shortening module lifespan unless UV-resistant materials are used.
- Humidity and moisture: Tropical or coastal locations with relative humidity above 70% amplify risks of moisture ingress and PID, contributing an additional 0.1-0.3% degradation annually unless mitigated through advanced sealing and module design.
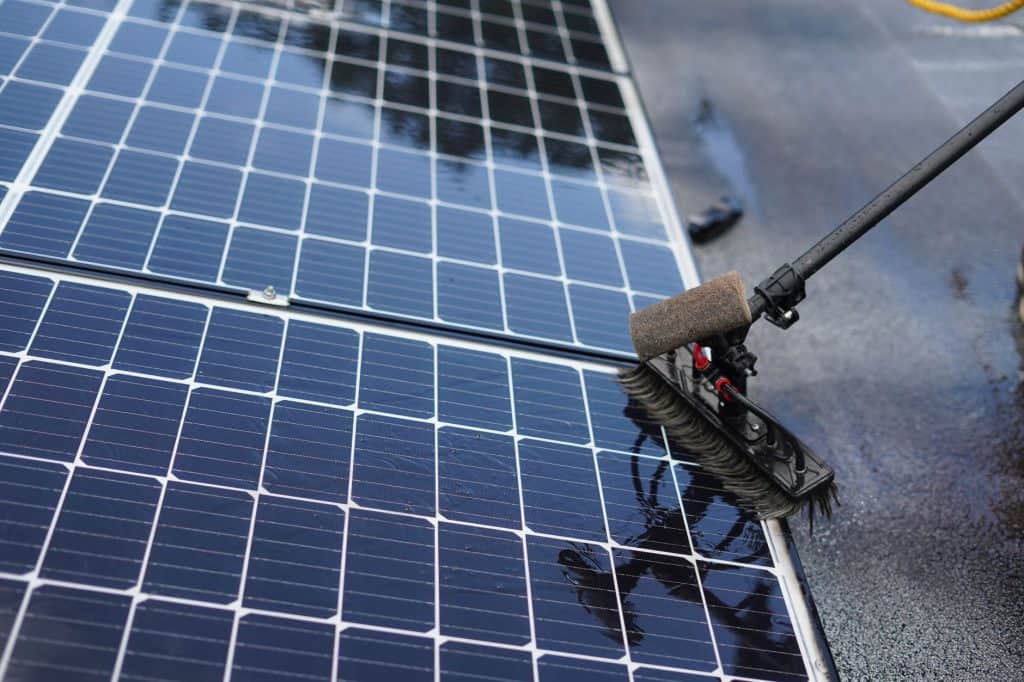
- Dust, pollution, and soiling: Accumulated dust and industrial pollutants physically abrade module surfaces and chemically react with coatings, lowering light transmission by 5-15% between cleanings if uncontrolled.
- Snow, hail, and salt mist: Snow loads cause mechanical stress, while hail can cause physical damage. Salt mist corrosion in marine environments accelerates glass and frame degradation, requiring modules with corrosion-resistant frames and coatings for durability.
Site-specific climate evaluation is essential pre-installation. Selecting solar panels with enhanced encapsulants, improved junction box sealing, and corrosion-resistant components mitigates accelerated degradation in severe environments.
Warranty Terms and Industry Standards Relevant to Degradation Rates
Solar panel manufacturers provide warranties to protect investors and property owners against unexpected solar panel degradation. These usually fall into two categories:
- Product warranty: Typically 10-12 years, covering defects in materials and workmanship, including frame integrity and junction box performance.
- Performance warranty: Extends up to 25 years, guaranteeing that power output will not fall below a certain percentage of the nominal output—commonly not less than 80% at year 25.
Performance warranties cap cumulative degradation at about 20-25%. If panels degrade faster, the manufacturer is responsible for repair or replacement under warranty terms.
These warranty commitments rely on compliance with international standards and testing protocols, primarily IEC 61215, which subjects modules to accelerated environmental stress tests including:
- Thermal cycling (typically -40°C to +85°C over 200 cycles)
- Humidity freeze (85% relative humidity at 85°C, followed by freezing)
- UV exposure simulation (minimum 15 kWh/m² dosage)
- Mechanical load testing (snow and wind load simulation up to design limits)
Adherence to these tests demonstrates module durability under controlled conditions, though real-world factors can accelerate degradation if installation or maintenance guidelines are not followed.
Warranty claims may be voided by:
- Improper mounting causing excessive mechanical stress
- Incorrect electrical configuration leading to PID or hot spot formation
- Neglecting routine cleaning and maintenance, leading to accelerated soiling and corrosion
Investors should review warranty documents carefully and ensure installation and maintenance conform to specifications to protect their inversión en energía solar.
Assessing Solar Panel Degradation in Solar Plus Garden’s 10 MW Investment Project
The Solar Plus Garden platform integrates detailed modeling of solar panel degradation rates into its 10 MW solar project, reflecting a conservative approach to forecasting long-term energy production and financial returns over 25+ years.
Project feasibility models incorporate:
- Initial year 1 losses estimated at approximately 2% based on manufacturer data for high-quality crystalline silicon panels.
- Subsequent annual degradation rates of 0.5% to 0.7%, adjusted for expected site-specific climate conditions.
- Performance monitoring data feeds to refine degradation assumptions post-installation.
This granular approach provides transparency to members of the Jardín membresía de la comunidad, combining solar returns with funding to support associated community and agricultural activities under clearly defined budget constraints.
Operationally, the 10 MW plant incorporates ongoing performance analytics, allowing early detection of deviations from expected degradation patterns. If accelerated performance decline is detected, targeted maintenance can be initiated to uphold warranty terms and sustain revenue streams.
Tools and Methods to Calculate and Monitor Solar Panel Degradation Rates
Continuous assessment of degradation is vital to optimize plant operation and financial outcomes. Common methods include:
- Degradation calculators: Software tools compare historical energy output data year-on-year against baseline manufacturer-rated outputs, factoring environmental conditions to calculate annual degradation percentages.
- IV curve analysis: Periodic current-voltage measurements under standard test conditions identify reductions in maximum power point indicative of performance decline.
- Thermography and drone inspections: High-resolution infrared imaging detects hot spots, microcracks, and shading-related issues that contribute to degradation.
Measurement frequency is key: daily or weekly data captures seasonal and operational variability, improving the accuracy of degradation estimates.
Advanced predictive maintenance platforms integrate real-time operational data with local weather inputs, automating alarms for abnormal panel behavior and facilitating proactive interventions.
Best practices recommend at least biannual formal assessments, supplemented by continuous automated monitoring, enabling effective management of solar panel degradation and maximizing plant life and returns.
Comparing Degradation Rates Across Different Solar Panel Technologies and Brands
Solar panels vary substantially in degradation rates depending on technology and manufacturer quality.
Monocrystalline silicon panels typically achieve the lowest degradation rates, close to 0.5% annually, benefitting from higher purity silicon and improved cell architecture.
Polycrystalline silicon panels generally degrade slightly faster, with rates often between 0.6% and 0.8% per year.
Thin-film solar panels, including CdTe and CIGS, may degrade up to 1% annually, influenced by material stability and encapsulation quality.
Manufacturers have introduced enhanced anti-reflective and anti-soiling coatings, improved EVA formulations, and reinforced module frames to reduce degradation rates. However, manufacturing process consistency and quality control remain decisive factors.
Independent third-party studies and certification test results (e.g., from TÜV Rheinland or UL) provide comparative degradation data under standardized conditions, aiding investors in selecting panels that balance upfront cost with expected long-term efficiency of solar panels and durability.
Para inversión en energía solar decisions, panels with certified low degradation rates and robust warranties minimize financial risk associated with output decline, allowing clearer projection of returns over multi-decade horizons.
Preguntas frecuentes
What is the typical yearly degradation rate for solar panels in a temperate climate?
Crystalline silicon panels generally degrade between 0.5% and 0.8% annually in temperate climates, with a higher initial drop of 1-3% during year 1.
How does solar panel degradation affect the overall return on investment (ROI)?
Degradation reduces annual electricity generation, decreasing revenue and potentially extending the payback period. Accurate degradation modeling ensures realistic ROI and cash flow projections essential for investment planning.
Are there warranty protections against solar panel degradation?
Yes, most manufacturers offer performance warranties limiting degradation to no more than 20-25% over 25 years, ensuring panels maintain 75-80% efficiency at warranty expiry.
Can environmental factors like heat and humidity accelerate solar panel degradation?
Yes. Harsh conditions such as high temperature variation, humidity, UV exposure, and pollutants can increase degradation rates by an additional 0.1-0.3% annually, depending on severity.
Conclusión
Incorporating verified solar panel degradation rates into project financial and operational planning is essential for reliable forecasting of energy yield and returns. Selecting panels backed by stringent warranty terms, understanding local climate impacts, and applying continuous performance monitoring safeguard against unanticipated losses. Technology improvements and updated degradation data require ongoing evaluation to align inversión en energía solar strategies with current industry performance standards.
Lecturas relacionadas
- Oportunidades de inversión en parques solares en 2026: lo que los propietarios e inversores deben saber.
- Integración de la energía solar en centrales eléctricas virtuales: lo que los propietarios e inversores deben saber.
- Analyzing Solar Price Trends in 2026: What Property Owners and Investors Need to Know