Saltar al contenido






LiDAR Solar Site Assessment: Rooftop vs Ground Data
A LiDAR solar site assessment answers a narrow, useful set of questions: how big is this surface, which way does it face, how steep is it, and what stands in the light path. That is geometry and irradiance. It is not condition, and it is not a substitute for a person standing on the roof. The practical value comes from deciding in advance which of those two jobs you are paying for.
The distinction matters more as portfolios grow. A manual survey crew measuring roof edges produces perhaps three to five measurements per building and regularly misses parapets, HVAC setbacks and the shading obstacles that decide whether a layout works. A LiDAR point cloud captures the same roof at 50–200 points per square metre, and it does so before anyone books a flight or a van. For a solar PV developer comparing dozens of candidate sites, that pre-flight geometry is the difference between a ranked list and a guess.
Why a LiDAR Solar Site Assessment Beats a Tape Measure on Rooftops
On a single building, a tape measure and a ladder win on cost every time. On a portfolio, they lose on arithmetic. Travel and surveyor time dominate the per-roof cost of a manual visit, and neither falls when you survey the tenth roof instead of the first. A single airborne pass covering many buildings spreads its fixed cost across all of them, which is why screening economics flip once a candidate list gets long.
The evidence base has shifted too. The U.S. Department of Energy’s Solar Energy Technologies Office and NREL have published estimates of rooftop solar fotovoltaica deployment potential built on LiDAR-derived building models. That modelling approach has become familiar to lenders, grant reviewers and municipal planners, and it is one reason a point-cloud-derived yield estimate now reads as normal supporting evidence rather than an exotic extra.
The trade-off is worth stating plainly, because vendors rarely do:
- LiDAR answers: roof outline, plane count, tilt, azimuth, parapet height, obstruction footprints, canopy height, gross and usable area.
- LiDAR does not answer: whether the membrane is cracked, whether the mounting feet are corroded, whether the structural deck will take the added load, or whether the roof is due for replacement in two years.
A practical rule follows from that split. Use LiDAR where the number of candidate roofs is large or physical access is expensive — multi-site portfolios, remote assets, buildings you do not yet control. Use a site visit where a single roof carries high-value risk, and on every roof before procurement. On rooftop PV screening, the point cloud is the ranking tool; the site visit is the sign-off.
What a LiDAR Point Cloud Actually Contains (and What It Does Not)
A point cloud is a set of XYZ coordinates, each point carrying an intensity value and a return number. Classification routines then sort those points into ground, building, vegetation and clutter. Everything downstream depends on how well that classification was done.
For a site assessment, the usable outputs are specific artefacts rather than a raw cloud:
- Digital surface model (DSM) — the top of everything, including roofs, chimneys and tree crowns.
- Digital terrain model (DTM) — bare earth, with buildings and vegetation stripped out.
- Roof planes — segmented surfaces with derived tilt and azimuth.
- Ridge and parapet lines — the edges that define usable area and drive setback rules.
- Canopy height model — vegetation height above ground, used for shading analysis.
What aerial LiDAR alone cannot give you is module-level shading from a thin chimney flue or a satellite dish. Those objects are smaller than the sample spacing of a typical airborne flight and may be missed or smeared. That detail usually requires a higher-resolution drone LiDAR or photogrammetry pass on the shortlisted roofs, not a re-flight of the whole region.
The model is also only as good as its coordinate reference frame. An unprojected cloud, or one carrying positional error above roughly 0.3–0.5 m, will misalign against cadastral boundaries, utility records and as-built drawings. At that point the panel count on a rooftop is not approximate — it is wrong, and it is wrong in a way that looks precise on a screen.
Turning the Point Cloud into a Rooftop Solar Design You Can Build
The extraction-to-design sequence is short enough to standardise:
- Classify ground and buildings.
- Extract roof planes with their azimuth and tilt.
- Apply the setback rules of the applicable local code for fire access and wind uplift.
- Run inter-row and obstacle shading.
- Export to the solar design tool for layout, string plan and irradiance modelling.
Step two carries more weight than it appears to. Roof plane tilt and azimuth feed directly into the irradiance calculation, and a 10° error in tilt on a low-slope roof materially changes the modelled yield. That is the kind of error a quick tape measure produces on a roof with a slight fall to a drain, and the kind a DSM resolves properly.
Step three is where the model has to be told what to do. Fire-access setbacks and structural load limits come from building codes and a structural engineer, not from LiDAR. They enter the design as input rules. No point cloud infers a code requirement, and any workflow that implies otherwise is hiding a manual step. Enforcement of those rules stays with the local authority having jurisdiction, and the applicable edition of the governing code varies by country and is subject to change.
The output is a module layout and string plan that an installer can check against site visit photographs before anyone commits to procurement. For rooftop PV, that check is where a plausible design becomes a buildable one.
Agrivoltaics: Using LiDAR to Map Ground Under Solar Arrays
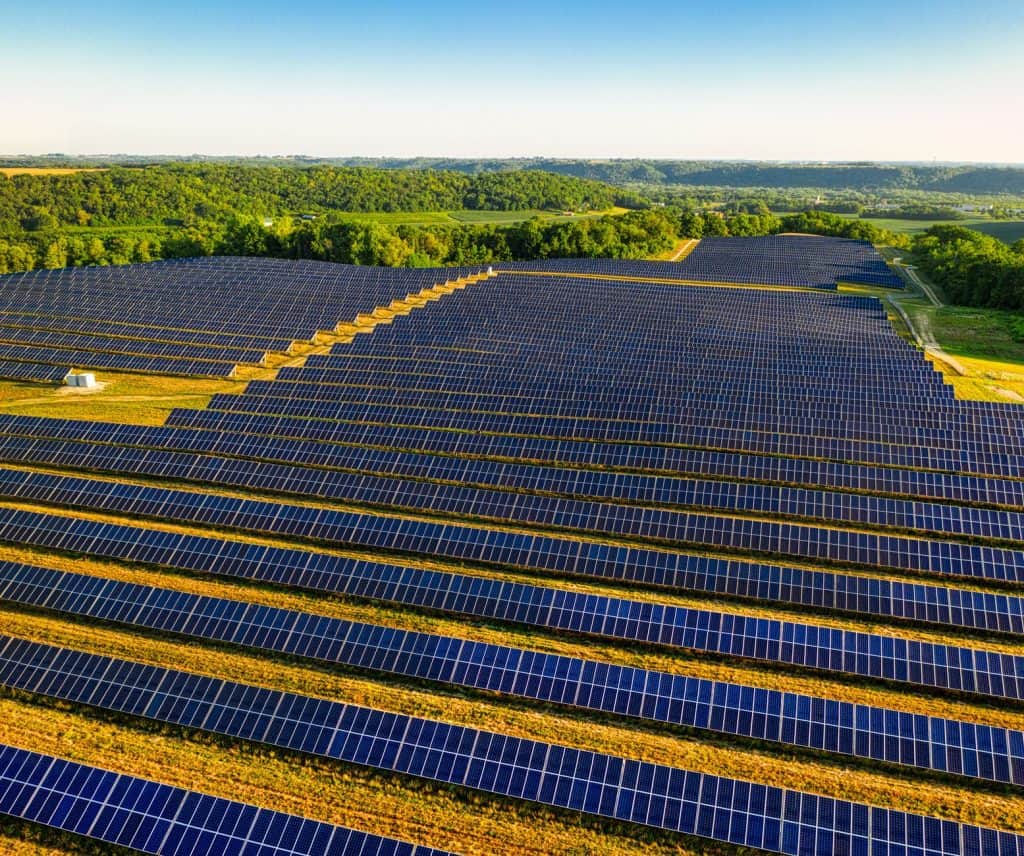
On ground-mounted and agrivoltaic sites the same point cloud does different work. Classification separates vegetation height, drainage lines and slope. The DSM shows where array rows can sit without earthworks above a defined cut-and-fill threshold — a threshold you set with your civil engineer, not one the data supplies.
Canopy height models matter in both directions here, which is the part rooftop thinking does not prepare you for. You need to know how the array shades the crops, and how existing trees shade the array. On a bare roof only one direction exists. On an agrivoltaic plot, both reduce output or yield, and both need modelling before row spacing is fixed.
Slope and aspect derived from the DTM drive row spacing and the tracker-versus-fixed-tilt decision. A 2–3% slope change across a plot is enough to change mounting and drainage design, which is why a plot-level flight beats extrapolating from a handful of spot levels.
This is where the Solar Plus Garden structure connects to the data question. The membresía de jardín and the optional jardinera (€20/month, 18 deliveries of fresh produce a year) sit with a separate legal entity that holds the exclusive right to use the Garden concept — distinct from the Serbian DOO that owns and operates the plant. Site data collected for agrivoltaic planning stays with the solar side and does not cross into the Garden entity. That separation is worth knowing before you agree where survey files get stored, because a procurement path for a solar PV build should never depend on the boundaries of a community agreement.
What It Costs to Commission LiDAR vs a Manual Site Visit
Cost is driven by three variables: point density, site area and access. Airborne LiDAR is priced per hectare flown. Drone LiDAR is priced per flight plus processing. A manual roof site visit is priced per property plus travel. None of those are interchangeable units, which is why comparisons go wrong.
The structural point is that manual cost scales linearly with the number of roofs and never benefits from volume, while a single airborne flight spreads its fixed cost across every building in the swathe. Screening economics therefore flip at some portfolio size — the exact number depends on your local day rates and flight pricing, and you should model it with your own quotes rather than accept a rule of thumb. A useful sanity check before you accept any quote: divide total campaign cost by the number of roofs, and compare that per-roof figure against the per-roof cost of your last physical survey, travel included.
Illustration only — not a quoted price. The table below uses stated assumptions to show the shape of the comparison. Substitute your own figures.
| Assumption | Option A: manual visit | Option B: shared airborne flight |
|---|---|---|
| Target roof | 200 m² | 200 m², extracted from a swathe |
| Coverage per campaign | 1 roof | 500 roofs in one flight |
| Cost driver | Half a surveyor-day plus travel, per roof | Flight and processing cost per hectare, divided across 500 roofs |
| Point density achieved | Not applicable — hand measurements | Airborne density, adequate for screening; not for module-level detail |
| Deliverable | Sketch with 3–5 dimensions | DSM, DTM, roof planes, canopy height model |
| What is still missing | Obstruction geometry, shading, usable area at scale | Roof condition, structural adequacy, thin obstructions |
| Follow-up required | Design work from incomplete dimensions | Drone pass or site visit on shortlisted roofs |
Three costs sit outside that table and are routinely underbudgeted: processing and classification time, QA against ground control points, and a physical site visit on every shortlisted roof before construction. Budget the last one first. It is not optional and it is not a contingency line.
Where the Point Cloud Gets It Wrong: Urban Canyons and Data Gaps
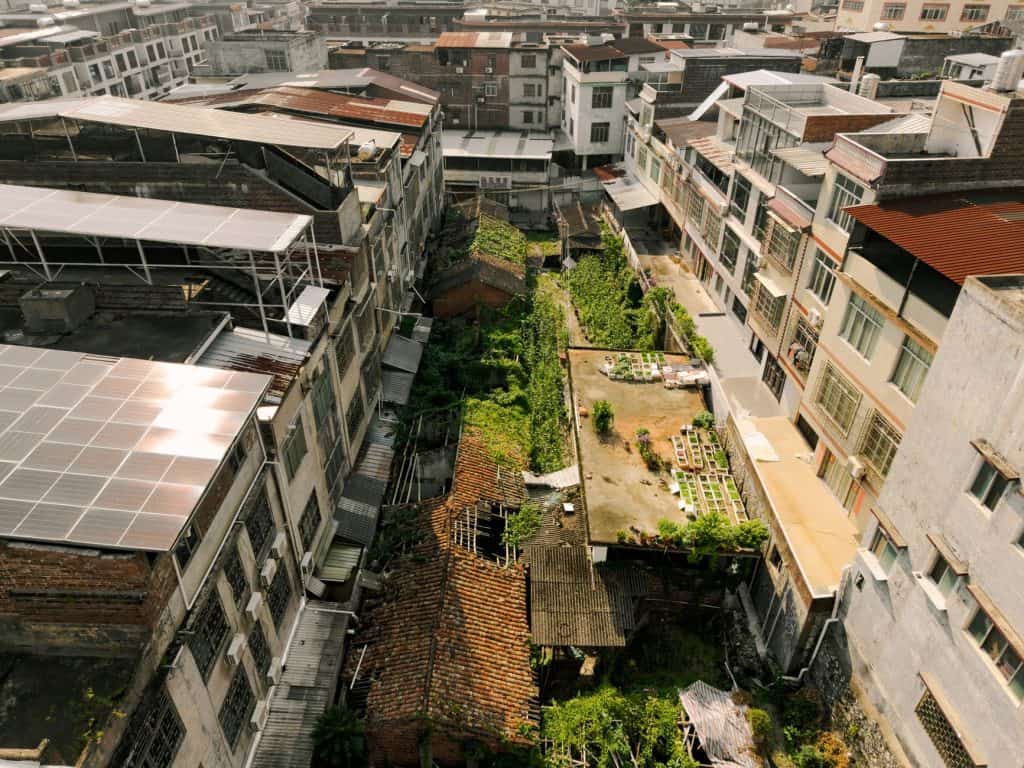
Dense urban settings produce partial returns and occlusion. In a narrow street, the laser may hit a balcony rail rather than the roof behind it, and the classifier may respond by inventing a slope that does not exist or dropping a parapet wall that does. The model looks clean. It is not.
Open national LiDAR programmes vary widely in vintage, density and licensing. A dataset from one national mapping agency is not interchangeable with another’s, and a stale flight can predate a roof extension, a new rooftop plant or a change of use. Free data is only free if it is current enough for the decision in front of you.
Mitigation is procedural, not clever:
- Cross-check the point cloud against ground control points and current aerial imagery.
- Flag cells with low return density as unverified rather than interpolating through them.
- Record the dataset capture date and licence with every site assessments file.
- Never let the model alone trigger a procurement commitment.
Risk runs the other way too. A drive-by that never went on the roof produces its own errors — a surveyor who saw the building from the street has confirmed nothing about the membrane, the penetrations or the plant room. The two methods are complements. An organisation that treats them as substitutes will be wrong in one direction or the other, and will not know which until construction.
Rooftop vs Ground-Mounted: Which LiDAR Pass Fits Which Site
The two site types are driven by different failure modes, so they need different passes.
Rooftop PV is driven by building footprint, parapets, HVAC clutter and fire-access rules. The practical split is airborne screening across the portfolio, then drone LiDAR at fine density on the shortlisted roofs where obstacle geometry decides the layout.
Ground-mounted and agrivoltaic is driven by topography, drainage, vegetation and access roads. Airborne LiDAR across the whole plot is the right first pass, with drone detail reserved for drainage design and any area where cut-and-fill is tight.
Illustration only. Two options for the same 1 MW target, with fixed comparison inputs:
| Input | (a) Ten rooftops, airborne screen | (b) One 1.5 ha ground plot, airborne |
|---|---|---|
| Dominated by | Parapets, HVAC setbacks, fire-access rules, roof condition | Slope, drainage lines, vegetation, access |
| Error that hurts most | Missed obstruction or misread parapet inflating usable area | Smoothed DTM hiding a drainage path or a slope break |
| What LiDAR settles | Which roofs are worth a drone pass and a visit | Where rows fit without earthworks above threshold |
| What still needs a site visit | Every shortlisted roof: condition, structure, penetrations | Ground truth on drainage, access and soil |
The decision criterion is not cost per hectare. It is how many candidate sites must be compared before one is committed. Ten rooftops in a screen exist to eliminate nine. One ground plot exists to be designed properly.
A 6-Step LiDAR Solar Site Assessment for a Portfolio of Roofs
- Define the decision. Screening, design or financing evidence — each needs a different point density and accuracy tolerance. Write the tolerance down before commissioning anything.
- Source the data. Open national LiDAR, a commissioned airborne flight, or drone LiDAR on shortlisted roofs. Record dataset date and licence at this step, not later.
- Process. Classify ground, buildings and vegetation; build the DSM and DTM; extract roof planes and the canopy height model.
- Apply design rules. Code setbacks, structural load limits and the manufacturer’s module dimensions enter as inputs.
- Design and model. Module layout, string plan, irradiance and shading, exported to the solar design tool.
- Confirm on site. A physical site visit on every shortlisted roof before construction, closing the loop with photographs and a condition report.
A short case study pattern shows why step six is not ceremonial: an operator screens forty roofs from open LiDAR, shortlists eight on usable area and orientation, flies drone LiDAR on those eight to resolve obstacles, designs on all eight, then visits them. Two turn out to have membranes at end of life and one has a structural deck that will not take the array. The screen did its job — it eliminated thirty-two roofs cheaply — and the site visit did the job the point cloud could not do at all.
Preguntas frecuentes
Can a LiDAR solar site assessment replace a physical site visit?
No. LiDAR gives geometry — roof planes, tilt, azimuth, obstructions, canopy height — but cannot report membrane condition, corrosion, or the state of an existing mounting structure. The practical sequence is a LiDAR screen across the portfolio, then a physical site visit on every shortlisted roof before any procurement commitment.
How accurate does the point cloud need to be for rooftop design?
For module-level design, positional error above roughly 0.3–0.5 m will misalign the model against cadastral and utility data and distort panel counts. Below that threshold, roof plane tilt and azimuth are usable for irradiance modelling; above it, re-fly or re-process before designing.
Is open national LiDAR data good enough, or do I need to commission a flight?
It depends on vintage and density. National datasets are free but can be years old and may predate a roof extension or a new rooftop plant. Check the capture date and point density; if either is inadequate for the decision at hand, commission airborne or drone LiDAR for the shortlisted sites rather than designing on stale data.
How does LiDAR help on an agrivoltaic site rather than a bare roof?
The same point cloud classifies vegetation height, drainage lines and slope. A canopy height model shows shading in both directions — of crops by the array and of the array by existing trees — and DTM slope drives row spacing and mounting choice. This matters on a ground plot in a way it does not on a rooftop.
What is the single biggest source of error in a LiDAR solar site assessment?
Unrecorded data provenance. A cloud with no capture date, no licence note and no ground control QA cannot be trusted for anything but a rough area estimate, however clean it renders.
The Decision
Run the assessment in two tiers: a portfolio-wide LiDAR screen to rank candidate roofs or ground plots, then a physical site visit on every shortlisted site before procurement or financing sign-off. That pairing gives you the evidence a lender or grant reviewer expects without committing a design to a point cloud that has never been checked against the roof itself.
The answer changes if you are evaluating a single building — where a manual survey is cheaper and a site visit is unavoidable — or if your national LiDAR dataset is stale or the site sits in a dense urban canyon, in which case commission a fresh flight rather than design on inadequate data. All schedule, tariff and permit references in this article are subject to change and should be re-checked against current local rules before you act.